library(muxViz)
library(igraph)
#>
#> Attaching package: 'igraph'
#> The following objects are masked from 'package:stats':
#>
#>     decompose, spectrum
#> The following object is masked from 'package:base':
#>
#>     union
library(RColorBrewer)
library(ggraph)
#> Loading required package: ggplot2
set.seed(1)
# Network setup
Layers <- 3
Nodes <- 20
layerCouplingStrength <- 1
networkOfLayersType <- "categorical"
layer.colors <- brewer.pal(8, "Set2")
Setup fanmod, see setup fanmod vignette
pathFanmod <- "../src-exe/fanmod_linux"Multilayer motifs
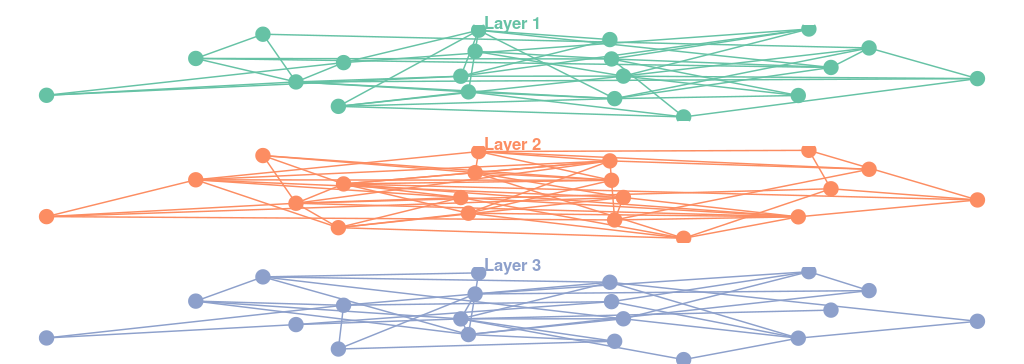
Generate an edge-colored network
nodeTensor <- list()
g.list <- list()
for (l in 1:Layers) {
  # Generate the layers
  g.list[[l]] <-
    igraph::erdos.renyi.game(Nodes, runif(1, 1.5, 2) * log(Nodes) / Nodes,
                             directed = F)

  # Get the list of adjacency matrices which build the multiplex
  nodeTensor[[l]] <- igraph::get.adjacency(g.list[[l]])
}
motifsTable <- GetMultilayerMotifsFromNetworkList(
  g.list,
  bin.path = pathFanmod,
  motifSize = 3,
  motifSamples = 100000,
  isDirected = FALSE,
  motifNullModel = "Local const",
  randomNetworks = 1000,
  randomExchangePerEdges =
    3,
  randomExchangeAttempts =
    3
)
#> 1/2 Setting up the algorithms...
#> 2/2 Calculating motifs...
#> Calculation Completed!
Process the results
cutAbsZscore <- 3
cutPvalue <- 1e-3
cutFrequency <- 0.01
sortMotifsBy <- "Frequency"
sorting
print("Sorting results from motifs analysis...")
#> [1] "Sorting results from motifs analysis..."
if (sortMotifsBy == "Frequency") {
  motifsTable <- motifsTable[order(-motifsTable$Frequency), ]
} else if (sortMotifsBy == "Z-score") {
  motifsTable <- motifsTable[order(-motifsTable$Z.Score), ]
} else if (sortMotifsBy == "p-value") {
  motifsTable <- motifsTable[order(motifsTable$p.Value), ]
}
cutting
print("Applying cuts to motifs table...")
#> [1] "Applying cuts to motifs table..."
motifsTable.cut <- motifsTable
motifsTable.cut <-
  motifsTable.cut[abs(motifsTable.cut$Z.Score) > cutAbsZscore,]
motifsTable.cut <-
  motifsTable.cut[motifsTable.cut$p.Value < cutPvalue,]
motifsTable.cut <-
  motifsTable.cut[motifsTable.cut$Frequency > cutFrequency,]