Installation
v3.1 is the latest and is continuously updated. It is an R package (still in development, not on CRAN) which can be installed in R by
devtools::install_github("manlius/muxViz")Backgroung
The R package muxViz enables the visualization and the analysis of interconnected multilayer networks. It supports the analysis of multilayer data:
- Multilayer correlation analysis
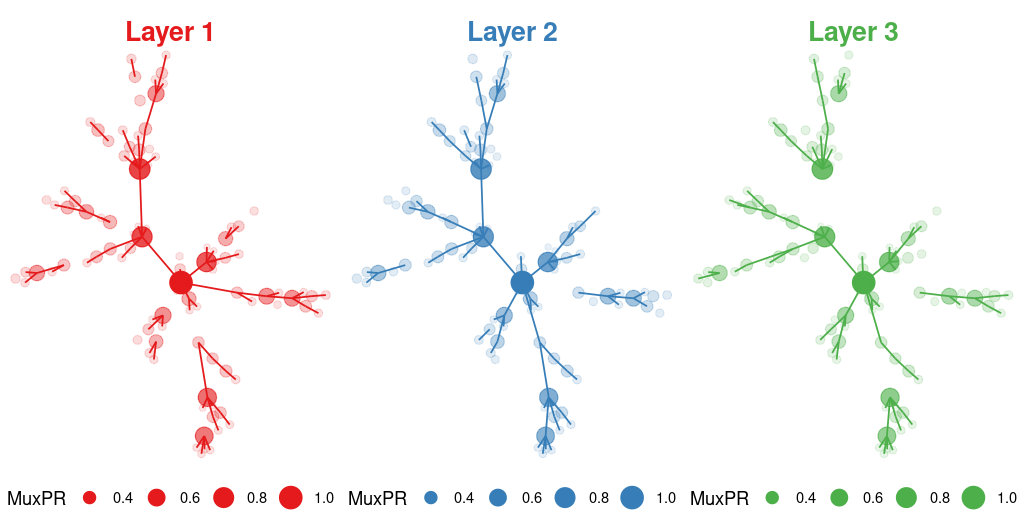
- Multilayer centrality analysis and annular representation
- Multilayer community structure detection
- Multilayer structural reducibility
- Multilayer motifs analysis
- Animated visualization of dynamical processes and time-varying multilayer networks
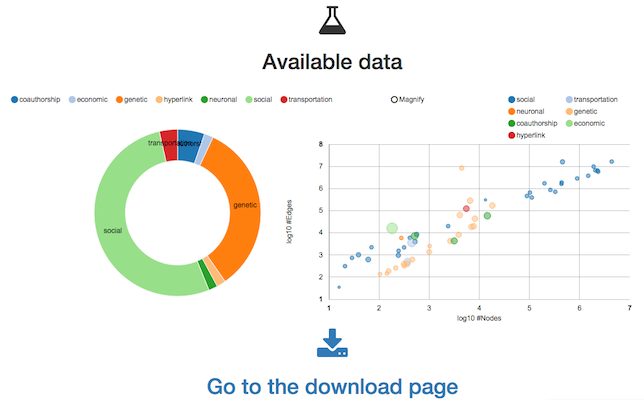
muxViz supports the analysis and visualization of the following multilayer networks: 
and the following layer layouts: 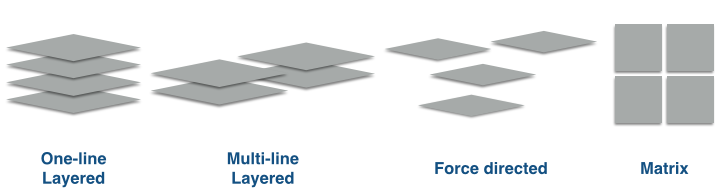
What is a multilayer network?
Multilayer networks are a class of models widely adopted to represent empirical complex system, including biomolecular networks (eg, interactomes, metabolomes), neuronal networks (eg, connectomes), information and communication networks, social/socio-technical/socio-ecological networks, economic and financial networks, urban and transportation networks.
You can read more on the dedicated Wikipedia page or this short illustrated summary.
Usage
# build edge-colored network by specifying layers
L <- 3
N <- 100
node_tensor <- list()

# Generate an edge-colored network
g <- sample_pa(n = N, power = 1, m = 1, directed = FALSE)
g_list <- list()
for (l in 1:L) {
    g_list[[l]] <- delete_edges(g, sample(E(g), floor(0.2 * length(E(g)))))
    node_tensor[[l]] <- as_adjacency_matrix(g_list[[l]])
}
Let’s consider a chain of layers, aka an ordinal network of layers and build the multilayer adjacency tensor
layer_tensor <- diagR(c(1, 1), 3, 1) + diagR(c(1, 1), 3, -1)
M <- BuildSupraAdjacencyMatrixFromEdgeColoredMatrices(node_tensor, layer_tensor, L, N)
Compute some centrality measures
# PageRank
pr <- GetMultiPageRankCentrality(M, L, N)
# Degree versatility
deg <- GetMultiDegree(M, L, N, isDirected = F)
and do some plotting
News
Check the changelog for the release news.
Citation
If you use muxViz (or any part of muxViz, or images available in the gallery) for your multilayer analysis and visualization, you should cite the paper:
Manlio De Domenico, Mason A. Porter, Alex Arenas, Multilayer Analysis and Visualization of Networks, published in Journal of Complex Networks 3, 159-176 (2015) (Open Access)
Manlio De Domenico, Multilayer Networks: Analysis and Visualization. Introduction to muxViz with R. To be published by Springer-Verlag (2021)
Please, note that muxViz is based on some algorithms developed in other studies. You should cite the original paper(s) every time that you use those algorithms.
The Graphical User Interface
The previous implementation exploits a Graphical User Interface (working with any browser) to provide access to many customizable graphic options to render networks.
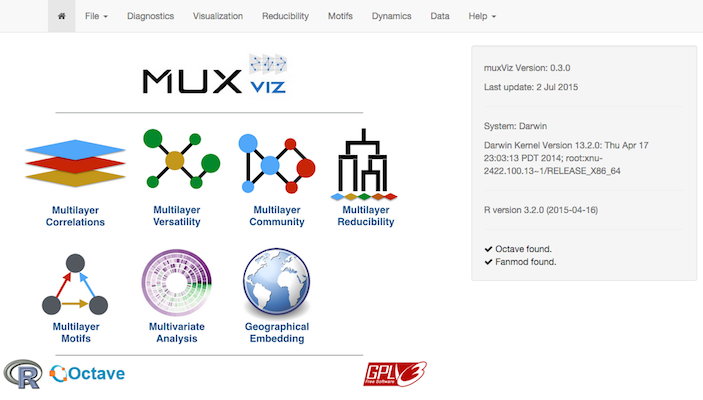
More details on the GUI (requirements, installation and usage) can be found in the GUI README.
Copyright
(C) Copyright 2013-2021, Manlio De Domenico.
This code has no warranty whatsoever and any kind of support is provided. You are free to do what you like with this code as long as you leave this copyright in place. Please, explicitly cite muxViz if you find it useful for your visualizations.
- Copyright 2013-2021, Manlio De Domenico (manlio.dedomenico at urv.cat)
Each file in this folder is part of the muxViz package, if not specified otherwise by another license.
muxViz is free software: you can redistribute it and/or modify it under the terms of the GNU General Public License as published by the Free Software Foundation, either version 3 of the License, or (at your option) any later version.
muxViz is distributed in the hope that it will be useful, but WITHOUT ANY WARRANTY; without even the implied warranty of MERCHANTABILITY or FITNESS FOR A PARTICULAR PURPOSE. See the GNU General Public License for more details.
You should have received a copy of the GNU General Public License along with the package. If not, see http://www.gnu.org/licenses/.
Credits
This work has been partially supported by European Commission FET-Proactive project PLEXMATH (Grant No. 317614) (http://www.plexmath.eu/), the European project devoted to the investigation of multi-level complex systems and has been developed at the Alephsys Lab (http://deim.urv.cat/~alephsys/),
I am in debt with Alex Arenas for proposing this project, with Mason A. Porter and the members of the Alephsys Lab for invaluable suggestions and feedbacks.
I would like to thank Inderjit S. Jutla, Lucas G. S. Jeub, and Peter J. Mucha for making their code about multislice community detection available.
I would like to thank Martin Rosvall for allowing to distribute his C++ code for Multiplex Infomap under the AGPLv3 license.
I would also like to thank the following people for their unvaluable (voluntary) support to muxViz and parts of its development:
- Lucio Agostinho Rocha
- Francesc Font
- Patricia Gonçalves
- Kim Klark
- Sneha Rajen
- Maria Pereda
- Hiroki Sayama
- Tzu-Chi Yen
- Rafael Pereira
- Yuriko Yamamoto
- Rodrigo García
- Sergio Alcalá-Corona
- Guillermo de Anda Jáuregui
- Giulia Bertagnolli
The development of muxViz has been funded, or is currently funded, by the following entities and institutions:

Donation
muxViz is a free and open-source platform that has been used for scientific purposes in a variety of disciplines, including computational social science, computational neuroscience, computational biology, computational psycholinguistics, multi-modal transportation engineering and physics.
Since January 2016, muxViz is periodically updated and maintained for free by its developer and its enthusiastic community of users (the muxVizers).
If muxViz helps you with your research and reduces your time to develop, you can give us a cup of good coffee :)
BTC: 19RGUCZjSzvbjY5xEWz3GNg7MnMiPyEgbB
ETH: 0xe5027b44782a4b832a23773ffdb57658aff62e31
XMR: 49pQ1B2m2UHaKotqF8h1E89um9rnMPvAHEfGUET1icQUaxBV1KFhuTNVpsF6Kf4bf5dZwWvmdzYn4D7rKcL4v2ee3tH4E2L
Paypal:
